|
Matching means to obtain a map function with the two lists of
coordinates and brightness: detected stars list from an image and
extracted star data list from a catalog.
If which data is the counterpart of any star in the image is clear, the
map function can be calculated with any two pairs.
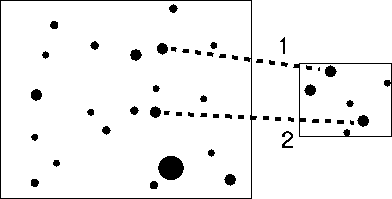
But actually the two lists are not related to each other.
Therefore the system calculates many map functions with many probable
counterparts and tries to find out true map function among them.
In this way, it expects that the value of map function calculated with
wrong counterparts hardly overlaps and the value of true map function is
obtained most frequently.
Definitely, the process of matching is as follows.
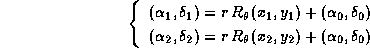
- Selects three pairs from the detected stars list from the image
and extracted data list from a catalog.
- If the triangle of the three stars selected from the detected list
and the triangle from a catalog are not similar, these pairs are
regarded as wrong counterparts.
If similar, go to next step.
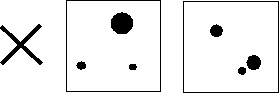
- If the brightness of each pair is very different, the pair is
regarded as a wrong counterpart.
If similar, go to next step.
- Now that the three stars from the image and those from a catalog
are probably counterparts, so the system calculates a set of parameters
of map function.
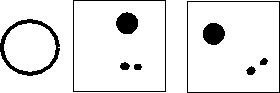
- For all triangles, repeat the step 1-4.
- The most overlapping set of parameters is adopted as a true map
function.
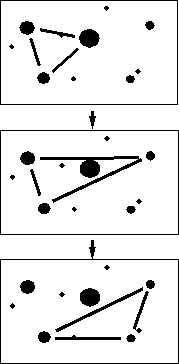
First of all, I made an experiment with a test data.
The data is a 600  400 virtual night sky containing 200 stars in
it.
The difference of the brightest and the faintest is 10 steps.
Then the system makes a copy of a partial rectangular region.
It becomes an artificial photo image.
The width and height of the image is about 400 virtual night sky containing 200 stars in
it.
The difference of the brightest and the faintest is 10 steps.
Then the system makes a copy of a partial rectangular region.
It becomes an artificial photo image.
The width and height of the image is about  of the sky.
Because there should be some errors in actual photographs, the system
changes the position and brightness slightly when copying: about of the sky.
Because there should be some errors in actual photographs, the system
changes the position and brightness slightly when copying: about  pixels in position, about pixels in position, about  steps in brightness.
In addition, 1 - 4 new objects are also appended.
Then it tried to calculate the map function between the artificial photo
image and the sky.
In this experiment, the approximate position input beforehand should be
in the area of the image, and the approximate width of the image should
differ less than 20% errors from the true value.
As a result of trials so that the system could tell where the image
should be in the virtual sky correctly, the process mentioned before is
implemented as follows. steps in brightness.
In addition, 1 - 4 new objects are also appended.
Then it tried to calculate the map function between the artificial photo
image and the sky.
In this experiment, the approximate position input beforehand should be
in the area of the image, and the approximate width of the image should
differ less than 20% errors from the true value.
As a result of trials so that the system could tell where the image
should be in the virtual sky correctly, the process mentioned before is
implemented as follows.
In this experiment, the system could obtain true map function in all
several dozens of trials.
Therefore, the process mentioned above is suitable even if the positions
or brightness of stars have some errors, or if there are some objects
existing in only one side like a new star.
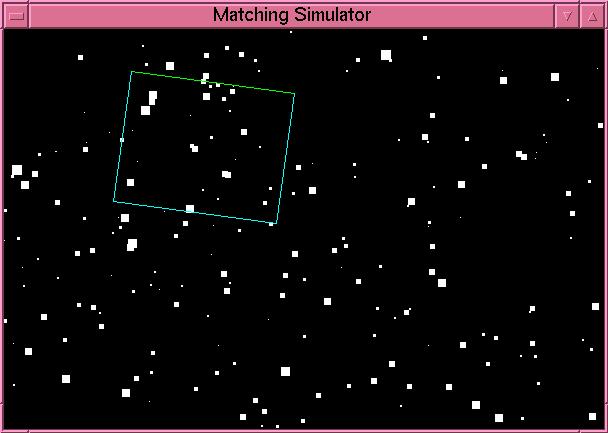
Figure 2: Virtual night sky
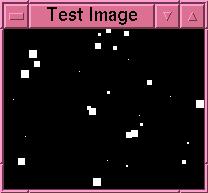
Figure 3: Artificial photo image


Then I made some experiments with real images and star catalogs.
Star catalogs generally contain all star data in the whole celestial
globe, so the system at first chooses required stars in the neighborhood
of the image area, with the approximate position and width of the image
input in advance.
It needs to extract stars around the position in the four times area of
the image, because the approximate width is between half and twice of
the true value and the approximate position is surely in the image.
Now that the system deals with real images, it has to convert the
brightness of detected stars from an image to magnitude to compare with
stars in catalogs in matching.
The process is as follows.
- It sorts the detected star list from an image in order of
brightness.
- It also sorts the extracted star list from a catalog in order of
magnitude.
- It applies the magnitude of the brightest one in the extracted
list as that of the brightest one in the detected list. But actually,
the area of the catalog should be four times of that of the image, the
magnitude of the brightest detected star is the average of the four
brightest stars in the extracted list.
- For each detected star, the system applies the average magnitude
of four stars in the extracted list sequentially.

This process does not consider the brightness value of detected stars
directly but only considers the sequence and applies their magnitudes.
Therefore it causes some errors.
In the future, I will calculate the converting function from brightness
to magnitude in the method of least squares after applying in this
process and re-calculate magnitude of all detected stars.
By the way, real images contain much more stars than the test data and
the implementation determined with the test data was found to yield many
wrong map functions.
So I improves the implementations again as follows.
- The approvable limit of magnification rate to determine similarity
of triangles is reduced from 20% to 10%.
- The assumption of magnification rate is reduced as
 . .
- The r axis is also divided per
 at making the parameter
space a mesh. at making the parameter
space a mesh.
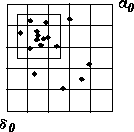
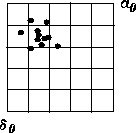
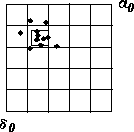
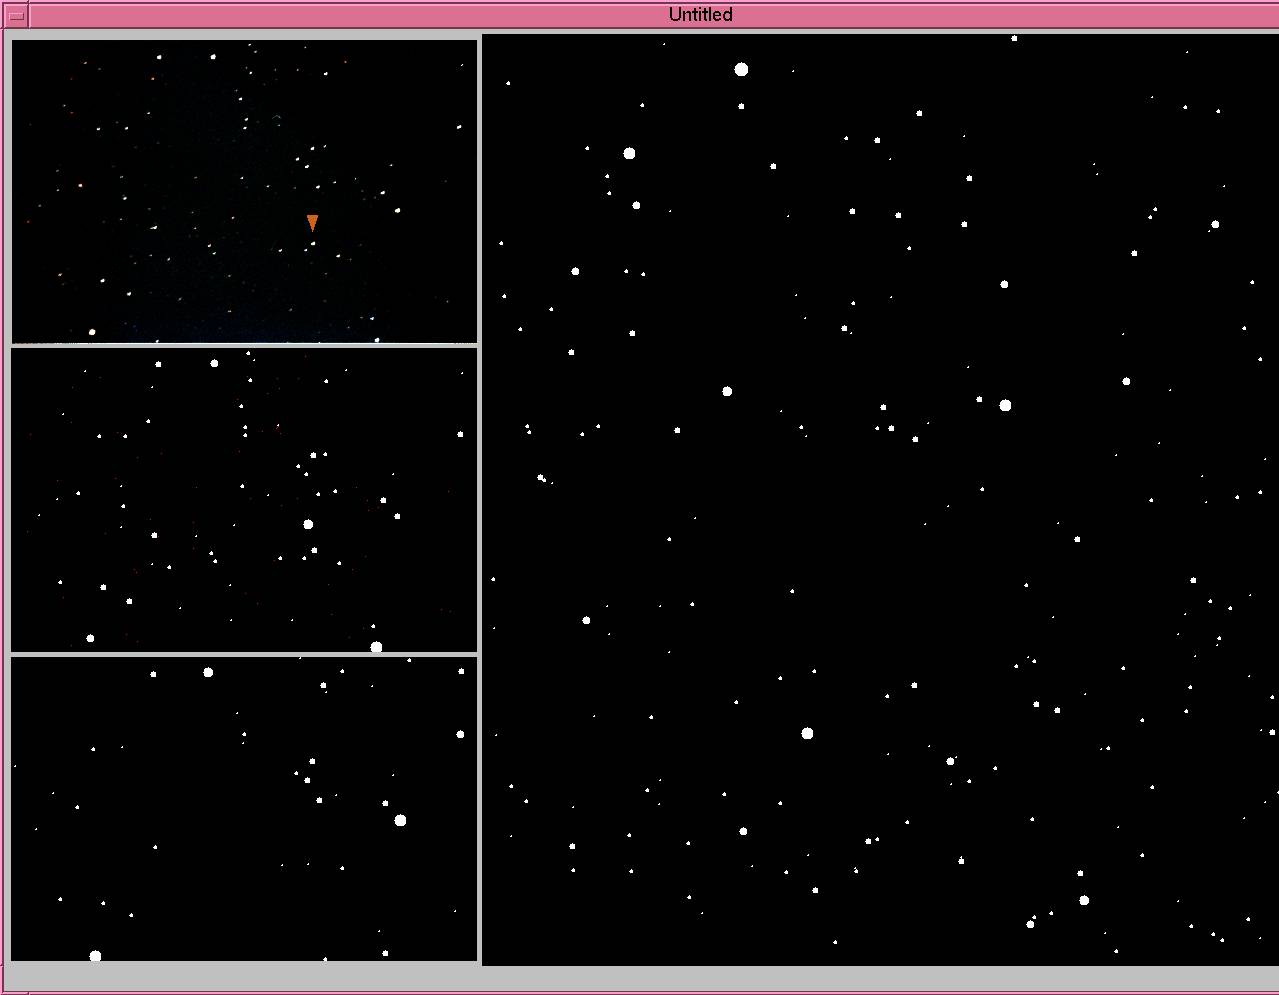
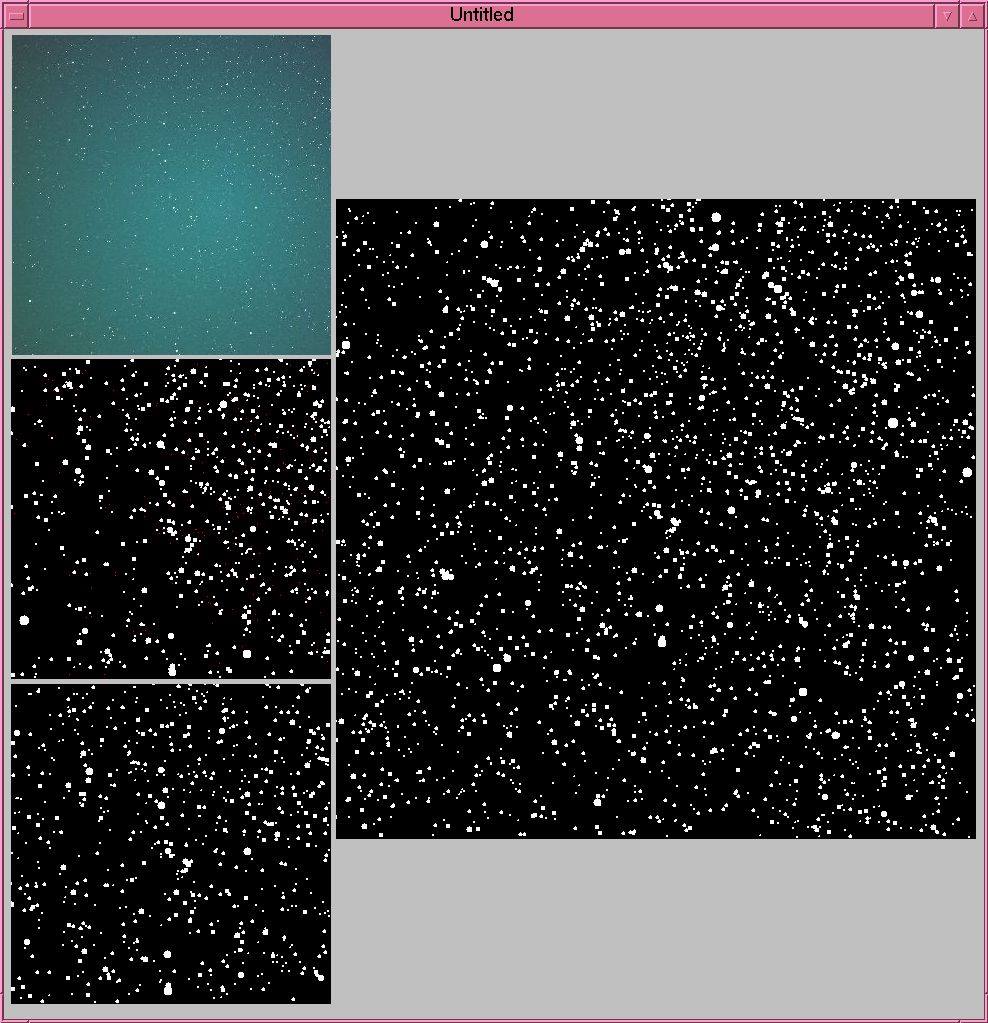
Here I show you the results of experiments with real images.
I use the Tycho Catalog as a real star catalog.
The image upper left is the original one.
The center in the left side shows the detected star list from the image.
The large image in the right is the chart around the approximate
position, whose data are from the Tycho Catalog.
The bottom one in the left side is the result, the system re-mapped the
extracted stars with the obtained map function and made the chart of the
same area as the original.
When the result chart is quite same as the original, it means the system
could obtain the true map function.
- Nova Cas 1995
- Comet Hale-Bopp
Photo: Atsuo Kuboniwa
Feb. 22, 1996 05:05:22 - 05:12:20 JST (6 min 58 sec)
Kukizaki Town, Ibaraki Pref.
BORG 125ED F4 (f=500mm), Takahashi EM-200
Fujichrome 400 Provia
In these experiments, true map function was obtained every time
independent on the number of stars.
However, there are two big problems actually and they obstructs to open
the system in the public.
- It takes extremely much time.
It took about several hours with PentiumPro 180MHz PC for one
experiment.
But that is mainly because the system in fully written in Java language.
The preliminary test system with a test data is in C++ language and
finished only within one minute, though the number of stars are a bit
smaller.
- It cannot tell one map function as a true one.
In the experiments mentioned above, the most overlapping parameter was
really the true value every time. But the value was not much more
overlapping than other candidates.
The difference from the second overlapping candidate is often only  . So I can say the true map functions were just barely selected
in those experiments.
However, when the user also input the approximate rotating angle in
advance (for example, when the user always takes images as the north
upwards), the system could exactly determine one true map function. . So I can say the true map functions were just barely selected
in those experiments.
However, when the user also input the approximate rotating angle in
advance (for example, when the user always takes images as the north
upwards), the system could exactly determine one true map function.
By the way, I have also tried the way to select four stars and check if
a pair of quadrangles s similar, but only to fail.
The system turned to take enormous time because the exponent increased.
In addition, the parameters could not converge on the true value.
I have also tried the reversed process.
That is, the system actually mapped all detected stars with each
candidate of map function, definitely the center of each block in the
parameter space, counted how many stars mapped exactly on stars in a
catalog, and found the parameter with the most exactly mapped pairs, but
only to fail either.
It seemed to take extreme time to finish and I interrupted it while
running.
|


