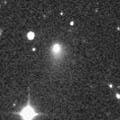
Epoch 2003 Oct. 8.0 TT = JDT 2452920.5
T 2003 Sept. 22.56134 TT MPC
q 0.9032799 (2000.0) P Q
z -0.0003653 Peri. 252.06756 -0.33229991 +0.91739637
+/-0.0000243 Node 12.80163 +0.44090196 +0.35635548
e 1.0003300 Incl. 98.74683 -0.83377589 -0.17718539
>From 98 observations 2002 July 29-2003 Jan. 4, mean residual 0".58.
Finding Charts
Magnitudes Graph
m1 = 9.5 + 5 log d + 7.5 log r [ ,-40] ( - 2003 Aug. 13)
m1 = 11 + 5 log d - 15 log r [-40, 0] (2003 Aug. 13 - 2003 Sept.22)
m1 = 14 + 5 log d + 50 log r [ 0, ] (2003 Sept.22 - )
* Gray curve is: m1 = 9.5 + 5 log d + 7.5 log r
The orbital elements are published on M.P.E.C. 2003-A30.
The charts are made with StellaNavigator Ver.2.0 for Windows
(AstroArts / ASCII).
The magnitudes graphs are made with Comet for Windows.
Copyright(C) Seiichi Yoshida (comet@aerith.net). All rights reserved.